

Regardless of where you sit in the DevOps pipeline — developer, site reliability engineer, IT Ops specialist, program manager, etc. — monitoring is mission-critical. You simply cannot deliver on the highest ideals of DevOps’ continuous integration and continuous development without robust and insightful end-to-end monitoring.
If you begin with end-to-end visibility across the health of your resources, you can “drill down to the most probable root cause of a problem, even to actual lines of code, fix the issue in your app or infrastructure, and re-deploy in a matter of minutes,” Rahul Bagaria, Senior Product Manager for Azure Monitoring & Analytics at Microsoft wrote. “If you have a robust monitoring pipeline setup, you should be able to find and fix issues way before it starts impacting your customers.”
Monitoring in Azure means continuous
Everything about transforming your corporate culture to a DevOps model relies on continuousness. Continuous integration. Continuous development. And to cap it all off? Continuous monitoring (CM).
CM is the natural outflow of the DevOps approach to work environments. If you can incorporate monitoring across each phase of your DevOps and IT Ops cycles, you can better ensure the health, performance and reliability of your apps and infrastructure continuously as they flow through developers into production and on to customers.
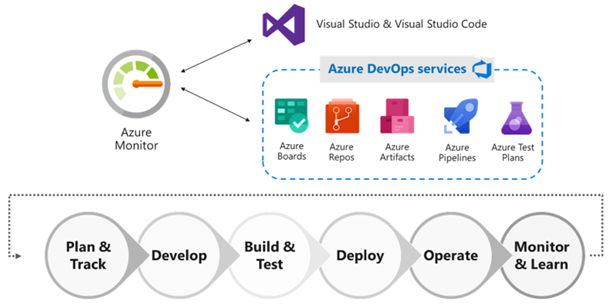
Azure Monitor
Azure Monitor allows you to collect, analyze and act on telemetry data from both your Azure and on-premise environments. By using this suite of tools, you can maximize performance and the availability of your applications while proactively identifying problems in seconds.
According to Microsoft, you can also “store and analyze all your operational telemetry in a centralized, fully managed, scalable data store that’s optimized for performance and cost.”
Azure Monitor will also integrate with DevOps, issue management, IT service management, security information and event management tools.
But, to leverage Azure Monitor to its fullest, you have to achieve continuous monitoring; that requires three primary areas of insight: monitoring your applications, monitoring your infrastructure and monitoring your network.
Monitor your applications
The first step toward full observability is to enable monitoring across all your web apps and services. That means adding Azure Monitor Application Insights SDKs to your apps at the code level. But, once you’ve done that, you’ll have everything you need to monitor availability, performance and usage of your web applications regardless of where they’re hosted (Azure, on-premise, etc.).
Whether you’re working in .NET, Java or Node.js, Azure Monitor integrates seamlessly. It also plays nice with DevOps processes and tools like Azure DevOps, Jira or PagerDuty.
“Once you have monitoring enabled across all your apps you can easily visualize end-to-end transactions and connections across all the components,” Bagaria wrote.
Monitor your infrastructure
Once you have full transparency into every application in your stack, next comes your infrastructure. It’s always tricky to predict what components of your application stack might have an issue at any given time, so it’s mission-critical to monitor every relevant component.
With Monitor, you can analyze and optimize the performance of your infrastructure, including virtual machines (VMs), Azure Kubernetes Service (AKS), Azure Storage, and databases; you can even monitor your Linux and Windows VMs, their health and their dependencies… all on a single interface.
“Azure Monitor can help you track the health and performance of your entire hybrid infrastructure, be it VMs, Containers, Storage, Network, or any other Azure services. You automatically get platform metrics, activity logs, and diagnostics logs from most of your Azure resources and can enable deeper monitoring for virtual machines or AKS clusters with a simple button click on the Azure Portal or installing an agent on your servers.”
Monitor your network
Because everything moves through your network when working in a cloud or hybrid environment, you can’t achieve continuous monitoring without insight into that network. With Azure Monitor, we can help you diagnose networking issues without logging into your virtual machines. You can trigger a packet capture, diagnose routing issues, analyze network security group flow logs, and gain visibility and control over your Azure network, all within the same monitoring platform.
Once you’re monitoring your apps, your infrastructure and your network in one solution, you can start to truly unlock the power of continuous monitoring.
Some best practices for Azure Monitoring
Set up actionable alerts with notifications and/or remediation: You can’t achieve continuous monitoring without a robust alerting pipeline. As such, we recommend setting up actionable alerts for all predictable failure states. These could be triggered by static or dynamic thresholds with actions coming on top of the alerts. The alerts could be as simple as text alerts, email, or push notifications for more simple triggered instances. And, when possible, there are ways to design remediation into the workflow with Azure Automation Runbooks or Auto-scaling in case of elastic workloads.
Prepare role-based dashboards and workbooks for reporting: Both sides of the Dev and Ops equation ought to have access to the same telemetry and the same tools. Azure Monitor is “designed as a unified monitoring solution for the entire team, and you can easily prepare custom role-based dashboards based on common metrics & logs,” according to Bagaria. You can also create multiple dashboards within the Azure portal, each of which can include tiles visualizing data from multiple Azure resources touching different resource groups and subscriptions. You can further pin relevant charts and views from Azure Application Insights to create custom dashboards; this can paint a complete picture of the health and performance of any application, infrastructure element or network state… all tuned to the reporting needs of individual teams or roles in your organization.
Continuously optimize through the ‘build, measure, learn’ framework: Building the right solution for your team or your customers is never a one-off success. It’s an iterative process that takes multiple swings to get right (and even then, you have to continue monitoring and honing the solution for it to remain optimal). You can’t ‘build, measure, learn’ without measuring… and you can’t measure without monitoring.
By setting up Azure Monitor correctly in your tech stack, you can track and optimize your health, availability, performance, and reliability… all while tracking end-user behavior and engagement to optimize your customer experience. Azure Monitor even provides impact correlation, which can guide areas of prioritization as well as accurate KPI formation.
The Microsoft Model
Microsoft didn’t just develop Azure and Azure Monitor… they completely rebuilt their IT culture and systems to transition to a distributed, agile DevOps approach by leveraging Azure and Azure Monitor. While we’re just pulling some of the more interesting bits from Microsoft’s own case study, it’s worth reading it in full to learn how vital Azure Monitoring is to an optimal tech environment for any business:
We’re nurturing a transformation to DevOps culture within IT. DevOps is the union of people, process, and products to enable continued business value to our customers. It puts technology and solution development in the hands of the people who know what the business needs, and it creates a more agile, responsive technology culture. DevOps has transformed the way that solutions are developed and operated.
The self-service focus and scalable infrastructure allowed us to move our monitoring environment from a centrally controlled and isolated manual service to an Azure-first, DevOps-driven, distributed, and consumable service that our business groups could use to gain true insight into their app environments. We established several goals early in the process to help guide our transformation efforts:
-
Democratize common monitoring and alerting management tasks. The centralized management and maintenance structure simply didn’t fit the DevOps model. We needed to put the controls for monitoring and alerting in our business app engineers’ hands and give them the freedom to create and manage their monitors, alerts, and reports.
-
Create a consumable, self-service solution. To give our business app engineers control over monitoring and alerting, we needed to give them a solution that didn’t require continued centralized IT intervention. We wanted to ensure that our solution provided automation and self-service capabilities that enabled business app engineers to start creating and tuning their monitoring and alerting solution when they wanted, and to grow it at their own pace.
-
Move from performance monitoring to health awareness. Individual metrics provided the raw data for our monitoring environment, but we wanted to provide a more intuitive view of the health of individual apps and the environment as a whole. The large number of platform as a service (PaaS) solutions required us to examine end-to-end health. Infrastructure monitoring and raw telemetry didn’t provide insight into the true nature of the app environment, and we wanted to expose the underlying information important to the individual business app owner.
If Microsoft understands the centrality of continuous monitoring to a healthy IT environment, we think it’s probably a good idea for you too. That’s where we come in, though — we can help walk you through the process of not only migrating to an Azure-based tech stack, but also building out the robust monitoring necessary for true DevOps bliss. Give us a call so we can put Azure Monitoring to work for you.